
If you've ever tried to Google statistics for your class assignment, business plan, or just for fun, you may have seen statistics from a source called Statista. You may have seen an easy-to-parse graph that shows exactly what you want, but when you try to go further you find yourself locked out of the information and asked to purchase an account. Worse, if you try to revisit the same link, you may be asked to subscribe. Did you fall to your knees and cry out? Did you wistfully touch your computer screen, watching what could have been slip away? Well, no more! Statista is here for DPL cardholders!
I really saw Statista in the salad days of 2018. I took an online course called Business Reference 101 to help me develop skills to deliver our small business appointments. Our course leader gave us temporary access to a number of powerful business resources, including Statista. Before, when I'd encountered Statista while searching, I thought, "This is great if this information is accurate, but how am I supposed to check its credibility?" But as I got to know Statista's full capabilities, I fell head over heels. We parted ways when the course ended and I could only hope fate would bring us back together. I pined for years. Every time the Reference Services department discussed adding new databases, I mentioned Statista as a pipe dream. But after years of persistence, the support of our fantastic Collection Development Office, and the generosity of Denver voters in establishing a new DPL Fund, this dream has become reality.
What is Statista and why am I obsessed with it?
Statista is an international research company that both performs its own research and gathers vetted research from other sources. The format of this information runs the gamut from at-a-glance statistics and infographics to compiled dossiers on a specific topic to the ability to build your own dataset from survey results.
We in the Reference Department help customers with all sorts of research needs. We provide in-depth research help in one-on-one appointment settings. We answer research questions that come our way through phone calls, emails, and chats. We create research guides for students. During our initial trial period, librarians who conduct both our business and student services stress-tested Statista's data. We had a really hard time finding information gaps.
Statistics & Infographics
Statista has a million statistics. Literally. More than a million, actually. If you keyword search almost any topic, it's likely there will be something relevant to that topic. You can also check out the statistics menu to see what's good, which is what I did to find the Big Mac Index. Feast your eyes (see what I did there?):
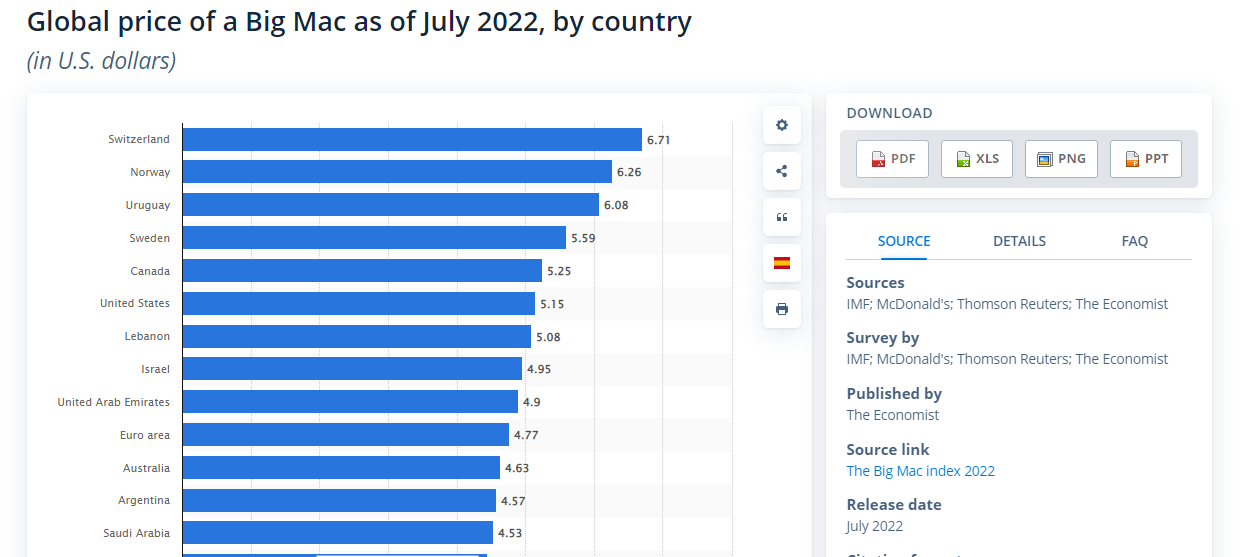
What does this information mean? On the right side, I see that the information is published by The Economist to show something called purchasing price parity (PPP). If I scroll down I can read how the Statista team explains the Big Mac Index. If I select the Source Link in the column to the right of the image, I can sometimes visit the source material itself (I also see numbers were updated in late January, so I may want to go back and check for them in Statista). If the original source is paywalled or not available anymore, Statista's extra context may be pretty valuable, but my mileage has varied. Even in a case with little context from the Statista team on a paywalled original resource, Statista linked me to another potentially relevant resource within their collection.
Statista also has a collection of infographics, which often seem to be topical to whatever is going on in the news. Sometimes, it seems like they're just interesting. Below is one about global musical tastes.
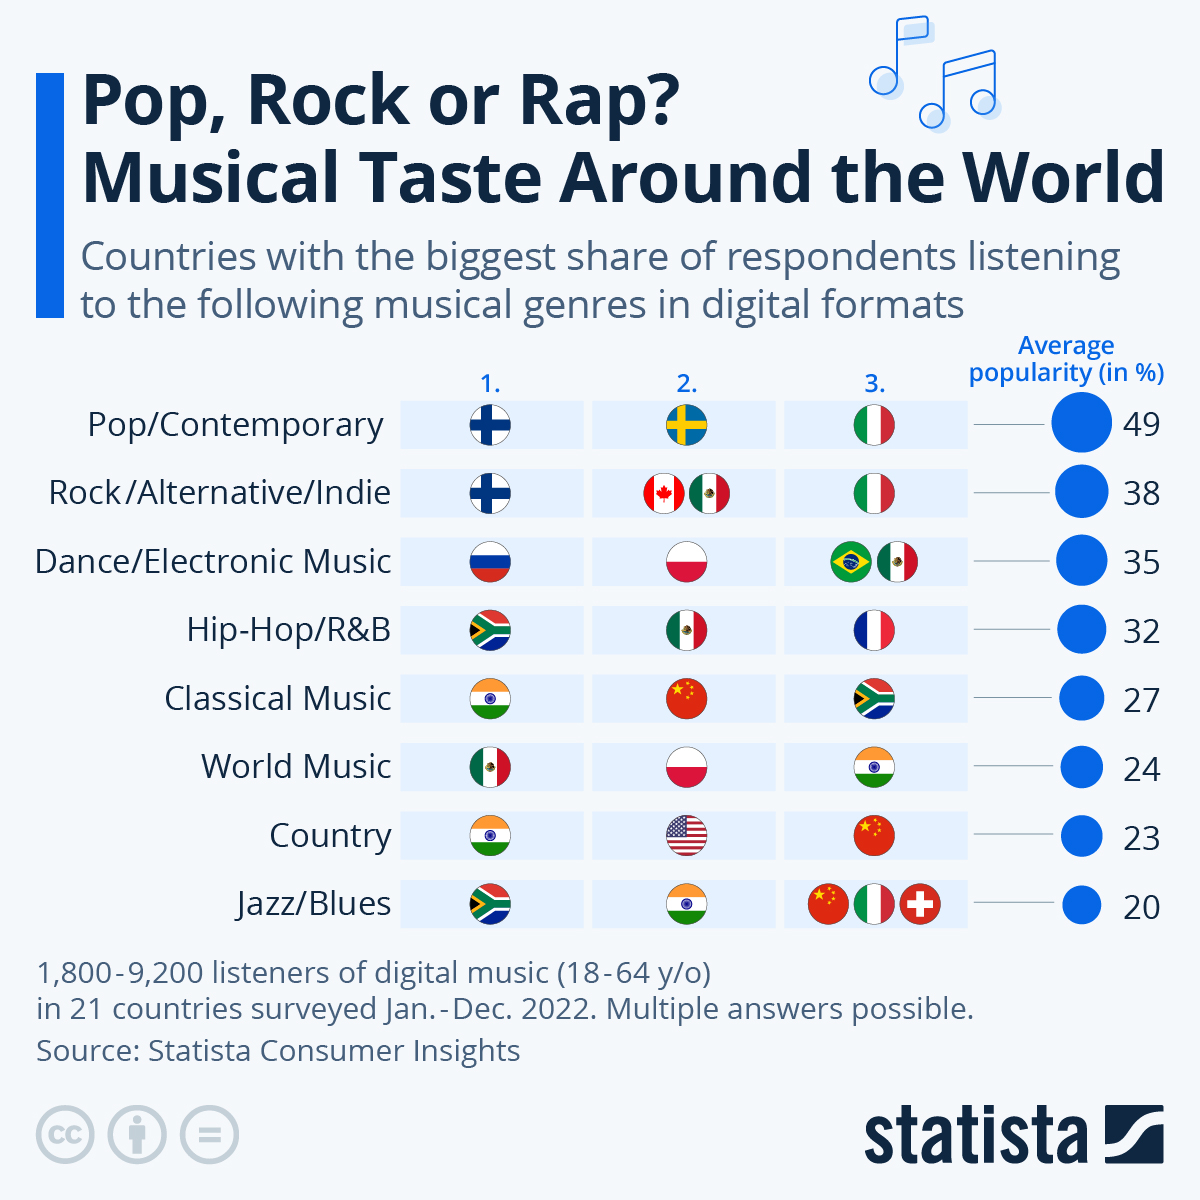 Who knew country music was more popular in India than in the US?
Sometimes infographics are even presented in a video format. Watch this one on the so-called "Great Resignation" to see 50 million Americans quit their jobs over an 18-month period.
Topics & Dossiers
Some research questions require cutting-edge information. When I mentioned that our Reference librarians tried to stump Statista, we drew on real topics that we received from K-12 students doing extended research projects and entrepreneurs trying to bring their innovative ideas to our business community. Even our materials buyers got in on the party by comparing market trends of media formats and demographics with our internal statistics.
Speaking as a business librarian, one thing that grinds my gears is the knowledge that data exists somewhere but I can't get at it. Private companies have no obligation to report their revenue. Marketing companies or professional associations may publish data on a specific industry, but sometimes these reports cost thousands of dollars for a single PDF. None of this gels with my personal librarian code that information wants to be free. There's no resource that unlocks all information, but Statista is a real game-changer in this regard, with oodles of industry and marketing reports that provide the specific information and beautifully complements some of our more generalized resources.
In addition to the type of at-a-glance information above, Statista also offers in-depth looks in the form of what they call Topics and Dossiers. One topic that both the business and student appointment teams seem to see again and again in our appointment and research guide request is that of mental health. Statista has a topic dedicated to U.S. Mental Health issues, with an introduction and some key statistics gathered by Statista's editors.
You'll notice that topic pages also allude to particular reports (sometimes called "Dossiers") that are also compilations of statistics, sometimes on more particular topics. For example, I may be interested broadly in mental health, but also more specifically on workplace wellness if I'm trying to start a business as an HR consultant, or maybe I'm trying to focus a research project on college students' mental health. And because Statista has researchers all over the world, they also have internationally-focused research. What is the state of mental health in Canada? What about in Brazil?
Consumer Insights
Our BizBoost team works with people who are making business plans, whether independently, in a class setting, or with a business consultant. They are trying to find their ideal consumer. We have a powerful tool for this called Demographics Now that let us view, learn about, and map costumer avatars in specific locations. It's amazing, but the data is not exhaustive. With Statista, we are now able to supplement that information with Statista's own consumer surveys on...frankly, an astounding number of topics. There are pre-made reports with survey results and there are also tools that let you make your own dataset, including some that provides insight into specific brands.
While I was playing with this feature, I found a topic highly relevant to my interests and downloaded the data into Excel: frozen pizza by age group. I highlighted all the survey questions that resonated with me, a Millennial on the go.
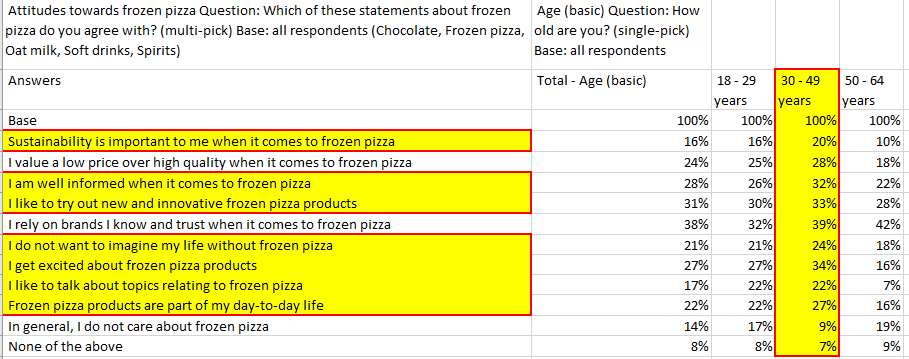
A particular favorite question (maybe my favorite in any survey I've seen?): "I do not want to imagine life without frozen pizza." The complete set of data contains a lot more information about specific brand names, such as a question about familiarity with a brand by name. Can you guess which was the most well known across all age groups? (I'll give you a hint, it's not delivery.)
Go forth and explore!
I could go on, but a longer post will just cut into your time to play with Statista on your own. Suffice it to say that you have a research project, a business plan, or just plain old curiosity, enjoy this new and exciting addition to our already great database collection! Go forth, Statista-istas!
If you have questions about Statista, another database, or anything else that could use some library know-how, please contact us via phone, email, or chat.
The photo used for this blog is in the public domain and can be found on pxhere.com.